Thursday, October 5, 2017

Post:0018 AUD / CHF Australian Dollar Swiss Franc , 6 of October 2017


AUD / CHF Australian Dollar Swiss Franc Analysis

After touching the major resistance area (0.774 - 0.780) & can't breakthrough it, & at the same time the technical indicators showed that the price reached the overbought area, so we expect the AUDCHF to decline till ( 0.71 - 0.70 ), but on the way down it will face two supports may curb a bit, first is the 0.7571, second is the major downtrend line connecting peaks from the middle of 2012 till 2017 & now acts as a support (price breakthrough it upwards).

Post:0017 AUD / CAD analysis , 4 October 2017


I think that AUD / CAD now is in the middle of a (major long term sideways / downward wave) & it's going to find a resistance level to form a peak close to the current price, but right now no entry at current movement, price will go up & down (osculant price) until it reach the desired resistance, whether it touch the downtrend line, reach the overbought area or touch a horizontal resistance so be patient.

Tuesday, October 3, 2017

Post:0016 Tadawul All Shares Index TASI "Saudi stock market" , 3rd of October 2017


Technical analysis for Tadawul All Shares Index TASI "Saudi stock market" , 3rd of October 2017


Ok, This time I will represent from the above chart so be focus on it, as you see it's daily time frame from January 2017 till now, the last two weeks; saudi market index declined from 7428 to 7244 & now losing declining acceleration due to impact with the support area no.01 (confirmed by three peaks & one bottom & one breakthrough rally) , also the current value now is approaching a potential trend line (confirmed if tested again and successfully function).

My point of view is that the next move will be rising by maximum 7365 (resistance) then back down again testing the potential line (I believe it will succeed) then the value will make a big move upwards breaking the 7428 level heading to 7586 (Historical peak of the year).

Monday, October 2, 2017

Post:0015 Gold 2nd of October 2017


Gold : October 2nd 2017
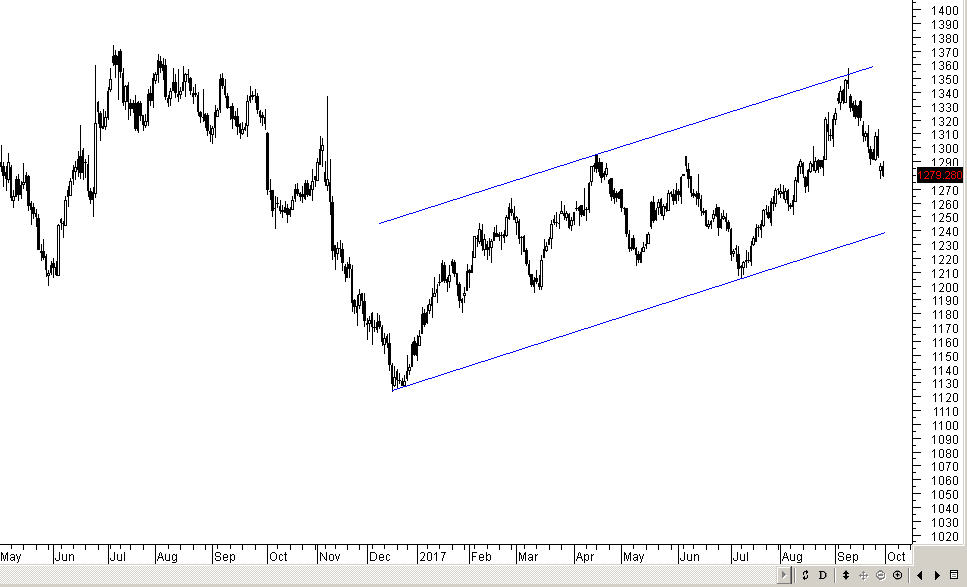
Potential support trend line (detect buyers slope) is now applied awaiting the third bottom to be connected to the first two bottoms & will be confirmed at that time.

On short term (daily frame) I had clear buy signal but I will wait & be conservative.

More likely I will wait weekly buying signal may be more closer to the potential trend line (less risky).


Post:0014 Crude oil " CL " 2nd of October 2017


Crude oil price chart may be confusing at first look but with some checking It will be more obvious.

first look; the resistance trend line had been broken upwards (bullish) & the price continue rising to form uptrend swing (higher high , higher low) on daily time frame ...

but now the price bullish rally move is exhausted (overbought) & reach a region with resistance levels that obstruct the price headway furthermore.

Selling power expected to appear soon as long bearish daily candles facing first support at "50.39" by breaking it downwards we will see more downward move to the "46"  (short selling opportunity).

Sunday, October 1, 2017

Post:0013 Dubai Financial Market " DFM " , 2nd October 2017


Dubai Financial Market " DFM " was moving in sideway contain some bearishness like (slightly lower high) & confirming the bearish potential by crossing downwards the 15th of August low "3579.56" to close at 3545.40.

We're waiting the upward corrective move to enter long position (Buying) & the reliable signal could be (for example, and not as a limitation) the relative strength index indicator " RSI " if the RSI's moving line enter the oversold area under horizontal line "30" then get back higher than the 30 line that's will be my buying trigger.

Post:0012 EUR / USD , 2nd of October 2017


I found some bullish potential in EUR / USD but still not confirmed yet ; so I'm waiting reliable buying signal that could be (for example, and not as a limitation) the relative strength index indicator " RSI " if the RSI's moving line cross the 50 (horizontal line) upwards that's will be my buying trigger.

Stop loss at 1.17170