Monday, October 30, 2017

Post:0036 GSPTSE 250 TORONTO S&P / TSX COMPOSITE INDEX (T.TOR) , 31 October 2017


Index close at 16002.78 on 30 October 2017

Market is in uptrend & reached a new high after broke 15943.10 (previous market high) by the last two session days candles.

The last candle (30 October 2017) looks fine (bullish) without any bearish/weakness candle pattern.

The broke of the previous resistance (15943.10) should be a buying opportunity (this is the current case now so hold long position) & target will be the downwards breakthrough of the (potential) support trend line applied on the chart.

Technical indicators ( macd & momentum oscillator) showed a (-)ve divergence (bearish).

If the horizontal support levels broken then sell till next support target below.


Saturday, October 28, 2017

Post:35 Ezz Steel (ESRS) Egypt , October 29th 2017


General Talking:

Technical analysis is not as easy as some believe, sometimes technical analyst falls as a prey of conflicting signals & probabilities, at that time he has to check a lot to reduce probabilities & to pick the most likely scenario to announce it.
Thank you, let's see what we have here.

Analysis:

EZZ steel, at first look on the intermediate & long terms we found that the price is moving in a sideways (period of consolidation / horizontal trend) but levels changed from one period to another.

First sideways zone area is the major area which contains the smaller sideways on smaller scale, this major area is in between strong levels of support (15.50) and resistance (22.80).

Relatively smaller sideways area emerged from the above mentioned major sideways is in between levels of support (18.60) and resistance (21.60).

Then, levels changed & a third stage of sideways occurs is in between levels of support (16) and resistance (18.55-18.60 area).

Notice: sideways here are getting narrower each change in level & that's mean that buying & selling powers are moving the price to the equilibrium point (When supply and demand are equal, i.e. when the supply function and demand function intersect).

On the short term (daily time frame), if we take a look at the last (9) days chart, we can easily see a pause in the price action looks like a triangle pennants shape converging the price range ( we can connect it's peaks together & bottoms together for later recognition of the breakout signal), so it is an indication of equilibrium & should be followed by breakout move after that (squeeze/pressure/tension), most likely it will be downwards because of the triangle pattern is considered as a continuation pattern (move after the triangle continue the move before it). So this is the first bearish signal & target will be downward at (15.50).

Let's have a look at the technical indicators;
macd & it's histogram indicate a bullish divergence on both daily & weekly time frames. First Bullish signal.
RSI on the daily frame also indicates a bullish divergence Second Bullish signal. & on the weekly frame it indicates an equilibrium, by applying trend lines on the weekly framed RSI forming a triangle which is good for later recognition of the breakout signal.

Nearest Resistance levels at 17.09 - 17.80 - 18.55
Nearest Support levels at 16.17 - 16 - 15.50

Potential downtrend line applied on the chart connecting (21 June-17 high at 21.60) by (28 Sep-17 high at 18.55) to act as a potential resistance sloping line.

Conclusion:

For the timing, I see that now is not the right moment to trigger buy signal, the bullish signals are much ahead of the price action & the sideways movement can continue for a while, & may probably move down to test any of the supports below before bulls take the price up, so wait.until the vision is clear.

Friday, October 27, 2017

Post:0034 USD/JPY US Dollar Japanese Yen , 30 October 2017 , Great opportunity to short


Analysis:

USDJPY on the short term is in an uptrend while intermediate & long terms are in a sideways.

On short & intermediate terms the resistance area is in between 114.242 up to 115.504 while support level will be 111.6xx , 110.xxx , 108.817 , 108.133 & 107.316.

& for long term the resistance will be 118.665 & support 107.316

On the intermediate term; trend line applied on the chart by connecting three peaks:
1- Aug.2015 peak
2- Nov-Dec.2015 peak
3- Dec.2016-Jan-2017 peak

& by visual observe; the above mentioned trend line get very close to the current price action to act as a resistance & Strengthens the resistance area (114.242-115.504) position.


And we should benefit from the intermediate & long terms "sideways mode" by taking out the Oscillators from the locker !! and use it, as the Oscillator technical indicators work best in the sideways mode, so I choose the most famous Oscillator "the Stochastic" & applied to the intermediate chart to find out that it indicates an overbought situation (breakthrough horizontal line "80" upwards) & also start to fall from there (stochastic crossing it's moving average downwards from the overbought area) & that's so bearish here. 

Also for more confirmation; the macd "histogram" (very reliable) indicat negative divergence on short term.

What about "Timing"  , I mean when exactly to push the sell button??

Ok here are three answers:

1- By applying the RSI on the short term chart, we have confirmation to connect the last two bottoms (8-Sep.2017 & 16-Oct.2017) to act as a potential trend line so we can use it , if the price breakthrough downwards then push the sell button.

2- On the (3 Hours chart) we have a potential channel & it says (Sell now ..) OMG.

3- On the one minute chart we have two peaks to connect to act as a resistance which will help to close the short position if the price cross it upwards ,, & we have the 30 minutes support (between 113.920-113.940) if it is crossed downwards then trigger sell.

Good Luck

Oh by the way don't forget to apply trailing stop loss.

Good Luck Again ;-)

Tuesday, October 24, 2017

Post:0033 Silver Futures , October 25th 2017 , "Bulls/Bears breaking bones phase !!"


Bulls & Bears seem to have reached the end of their epic raged clash on silver & soon we will witness a new era, but first they should pass through current bottleneck.

Once upon a time, Bulls were living an uptrend prosperous life until March 2008 bears decided to attack from (silver = 21.34) & they demolish a lot of Bulls gains till they besieged at (8.48) and from this point Bulls gathered their forces & and fortified themselves & start to repel-counterattack & succeed to make bears retreat to (49.77) but bears never surrender and the battle continued till today where each side has built his own trend line & each side knew that a day will come the trend lines will approaching each other & the trading range will squeeze & a possibility of a symmetrical triangle formation , sideways will be a fact , & here we are ladies & gentlemen, the moment has come , distances became very tight , technical indicators get confused but few outweigh the bears side on intermediate "weekly" time approach (bearish sentiment) ,  trend lines were everywhere & on all time scales (frames) , & we are waiting any breakthrough at any moment

nearest reliable support: 16.285
nearest reliable resistance: 17.446

Monday, October 23, 2017

Post:0032 Nikkei 225 What Next ??? , October 24th 2017


Long, Intermediate & short term; Nikkei is in a major Uptrend started from June 2016 & confirmed from November 2016, the major uptrend will end if the index value breaks 19239.50 (September 2017 Bottom) downwards.

Next station will be at "June 1996 peak" which recorded as 22531 & it will act as a resistance.

Weakness indication appears on all time frames by several technical indicators such as MACD & Histogram both show negative divergence.

Another technical indicator which is the Money Flow Index "MFI" (momentum + volume) also shows negative divergence & I could draw some helping lines on it (refer to the chart here/above).

I prefer to wait & see How will this Month (Oct.) end (Close) , all probabilities may really occur.

may start selling (short) from 22531 ?
may start selling (short) from testing the last declining help line (as if it is a resistance) applied on the MFI ?
may start selling (short) if this month's candle close below any trend line applied on the monthly chart.

I wouldn't be surprise if the index value continue rising above 22531 & that's cause it still didn't reach the extreme overbought / exhaustion / melting up phase yet, there is some space for more upward move but not for very long.

Saturday, October 21, 2017

Post:0031 NG Natural Gas Futures , October 23rd 2017 , Major Falling Wedge


As for the long term & very long term; Natural gas is in a major downtrend confirmed from October 2008, & this major downtrend will continue if the price breaks 1.594 (March 2016 bottom) downwards, & this major downtrend will end if the price breaks 3.884 (December 2016 peak) upwards.

Also it was noticed on the long term scale a formation of a major falling wedge (Bullish pattern) by connecting the two peaks together (February 2014 & December 2016 peaks) & connecting the two bottoms together (April 2012 & March 2016 bottoms) & the two lines are falling & at the end they intersect with each other forming the falling wedge & most likely the upper line will be broken upwards triggering the buying signal & the target will be by adding 3.57 to the breakpoint price value.

But for the intermediate term; it is in a sideways confirmed from May 2017, this sideways will continue as long as the price is in between (2.504 support & 3.413 resistance), also it is a good opportunity for trading (Horizontal Trading Zone).

& for the short term; it is in a minor downtrend confirmed from October 6th 2017.
Short term trend channels were applied on the daily time frame & now the price is inside a short term downward channel started from September 25th & confirmed from October 6th till now & retesting its boundaries, if the price breaks the upper then buy & target will be by adding 0.23 to the breakpoint price value & if it breaks the lower boundary then sell & target will be by subtracting 0.23 from the breakpoint price value.
short term downtrend will continue by breaking 2.756 downwards & will end by breaking 3.018 upwards.


Friday, October 20, 2017

Post:0030 EGX 100 INDEX Egyptian stock market , October 22, 2017


Trend is up for the short & intermediate term.

Short term trend channel where applied and indicates that the index value reaches/touches the upper boundary (resistance line) of the channel & started declining from there.

reliable indicators show an extremely overbought condition on longer term approach (weakness signals).

Resistance levels at 1775.63 , 1788.91 , 1827.29 , 1888.59

Index value need to breakthrough the resistance level "1827.29" upwards to continue the uptrend.

But if the index value breakthrough the upper boundary of the channel upwards; it will be an exhaustion phase "also called the melting up phase (as a comparison; imagine a rocket fuses during its rise !!).

Support levels at 1723.47 , 1630.17 , 1543.45

First weakness signal if value breakthrough the lower boundary (trend line) downwards.

Downtrend will be confirmed if value breakthrough the support level "1543.45" downwards.

Wednesday, October 18, 2017

Post:0029 USD / CHF US DOLLAR / SWISS FRANC , October 18th 2017


For a pair is already moving in a major sideways & a major trading range on longer term approach & for over mud situation!! the price entered an area encased with uncertainty, but as a technical analyst I can only think of the possibilities in percentage term & I adopt the higher possibility.

Swissy find a reinforced !! resistance at 0.98140 , 0.98370 & 0.98610 & seller slope trend line connecting three peaks (Jan 2017, May 2017 & October 2017).

& the most likely support at 0.970500

I expect swissy to move lower.

Tuesday, October 17, 2017

Post:0028 CAC 40 French Index , October 18th, 2017


CAC 40 French Index Analysis

What is controlling the market right now? the situation is a balance (equalize) between demand & supply, But most likely the next move will be in the hands of bears (sellers) I expect to see downward movement.

Support levels are:

5339.55
5338.14
5283.71 (major support)

Resistance levels are:

5372.97
5381.74
5442.10 (major resistance)


List of all levels (support/resistance) (from year 2007 till now) as a historical reference:

6168.15
5882.07
5442.10
5381.74
5372.97
5339.55
5338.14
5283.71
5259.47
5238.51
5231.65
5228.54
5217.80
5176.67
5142.10
5117.23
5011.65
4995.07
4733.82
4598.65
4169.87
4088.18
4007.97
3892.46
3789.11
2922.26
2693.21
2465.46


Sunday, October 15, 2017

Post:0027 German DAX 30 Index "GDAXI" , October 6th 2017


DAX 30 Index Analysis

First if we take a look at the Quarterly time frame, we will notice the great symmetrical triangle pattern which started from the lower high (June 2011) compared to (September 2007) high then followed by higher low (September 2011) compared to (March 2009) low then the value action succeeded to breakthrough the upper boundary of the symmetrical to reach it's target (as the book) at 12219-12390 (March-June 2015)

Then value declined to make a deep correction in a form of bearish swing (lower high lower low) at the longer approach frame, by connecting highs together & lows together to form a downward unconfirmed channel but somehow it is reliable due to it's longer time frame, then on (August 2016) value succeeded to breakthrough the upper boundary of the channel to reach a target at 12951.50 (June 2017).

This new peak allow me to apply a new (long) approach upward channel (a) inside the (longer) approach major upward channel (b), value now is testing the upper boundary of channel (a) as a resistance.

On the shorter approach, the macd histogram indicator form a bearish divergence on daily frame & this should be taken into account.

Supports level in order are:

12951.50
12841.70
12676.50
12490
12375.60
12301.40
& the Major support at 11868.80

The upper boundaries of the channels acts a a resistance levels.


Friday, October 13, 2017

Post:0026 EUR / USD , October 13th 2017


EUR/USD Analysis

I admit that Fiber chart at this time is confusing, ok I was distracted for some time & I couldn't predict the next move, & This is due to conflicting signals.

From the Bullish side:
1- There is a daily & weekly uptrend starting from May 2017.
2- Monthly & quarterly Bullish reversal (breakthrough the 1.1714 upwards & close above it which turned into support now) starting  from July 2017.
3- Major support area at 1.16 - 1.1616
4- MACD indicator forming bullish cross signal on the Quarterly time frame, also its Histogram forming a +ve divergence on the same time scale.

& From the other Bearish side:
1- Price now is in the middle of a an upward correction inside a major downtrend (yearly & quarterly frames) & a major downside trend line was applied and confirmed by connecting three major peaks (July 2008, May 2011 & May 2014), this line act as a very reliable resistance (Prices are still under this line).
2- Major resistance area at 1.2092.
3- A Bulk of reliable technical indicators showed a very strong sell signals at the same time (September-October 2017) on the weekly time frame.

After analysis conflict data, I go with the Bearish Side, but why?

Because;
1- the daily & weekly uptrend seems to be over (change in slope & momentum then start seeing lower high lower low swings).
2- Monthly & quarterly Bullish reversal (1.1714 breakthrough) also met with Monthly & quarterly resistance (1.2092) that turned the move to what it looks like a slip or more likely failed reversal.
3- In order of timing; the shorter-term approach time frame signals occur faster & before the longer-term approach time frames, so as for this case here, the bearish weekly signals are more important right now than the bullish quarterly signals because this is what will occur first (matter of timing).

1st Support: 1.1714
2nd Support: 1.16690
3rd Support: 1.1616

resistance: 1.19100

Thursday, October 12, 2017

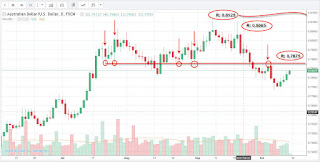
Post:0025 AUD / USD , October 13th 2017


AUD / USD Analysis

Aussie is more likely to move higher but it will make it slowly (matter of time), a very supportive area is down there which eliminates any potential deeper downwards move, and where we expect higher prices we should focus on the resistance levels (corrections/peaks);

R1: 0.7875

R2: 0.8065

R3: 0.8125

Stop loss: below 0.7733

Tuesday, October 10, 2017

Post:0024 US Dollar Index Futures , October 10th 2017


US Dollar Index Futures Analysis

First look at the Yearly time frame; it was clear enough to recognize a symmetrical triangle pattern which achieved it's target (as the book) 103.800 then value descend.

2nd look at the Quarterly time frame; it was clear that major support at 91.

3rd look at the Weekly frame, I started to notice the major resistance at 100 & trend lines became much easier to draw.
Also at the weekly frame with RSI attached; it indicates a very rare bullish signal (rise of an oversold area).

At last, on the daily frame; minor trend lines applied & the daily frame resistance was identified at 94 & the support at 92.5 , if the daily candle close above 94 we may see the beginning of a genuine rise for the US Dollar Index, but I think it will test the support (92.5) first before gaining enough buying power to continue upwards.